The test data generation engine that built in DTM Data Generator, DTM Test XML Generator and another product line for test data generation offers a rich mechanism to create complex data. In the article, we'll discuss a few cases related to statistical properties of the data sets.
Columns with Correlation
By default, the data generator produces independent values with linear distribution. If we have two columns(F1 and F2) generated by "random float number between 10 and 20" ( $RFloat(10,20) engine call ) where are completely independent: in our test we got Pearson's correlation coefficient about -0.0035 (value 1 means identical values).
To create the second value depended on the first one we should use engine's expression. It will include source value and the variable part. This variable part range defines correlation value. Let's start from $$(@'F1'+$Rint(10,20)) that means add random integer number between 10 and 20 to F1 value and use it as F2. In this case correlation coefficient is about 0.69 i.e. values are depended.
In the second test we use $$(@'F1'+$Rfloat(0,2)) expression, i.e. we added random float number between 0 and 2 to F1 value. The Pearson's correlation coefficient is about 0.98 for this pair. It is a very strong correlation.
Of course more complex dependencies can be defined in this kind of expressions. For example, $$(@'F1'*$Rfloat(0,2)) gives correlation coefficient about 0.30 only.
Normal Distributed Data with Clusters
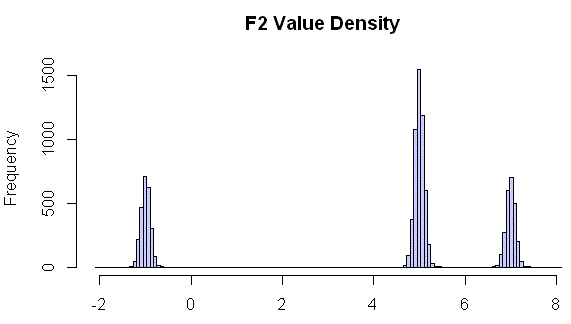
Let us continue with the following task: we need test data with 3 clusters around -1, 5 and 7 with Gauss distribution about this values. Us we described in the previous article $RFloat function can provide data with standard normal distribution, not with even only. There is sample engine call $RFloat(-2,0,3,%.3f,Normal,0.1) for values around -1 i.e. between -2 and 0.
The second task is clusters creation. We'll use $List function for this purpose. The second form of the function allows users to provide each case probability:
$List(false,$RFloat(-2,0,3,%.3f,Normal,0.1), 25,$RFloat(4,6,3,%.3f,Normal,0.1),50, $RFloat(6,8,3,%.3f,Normal,0.1),25)
We've generated 10 000 test data rows and created density histogram. There is:

As you can see we now have 3 clusters of value with standard distribution around required points.
Limited Value Pairs
In the last example, we dwell on the generation of (x,y) pairs of coordinates limited by a parabola. We'll generate x values between -1 and 1 with even distribution and limited by x*x value. There is no problem with x value: $RFloat(-1,1,3,%.3f) is very simple to understand.
The Y is more complex. We have to create random value between 0 and x. The data generation call for this case is $Rfloat(0,$$(@'x'*@'x'),3,%.3f)
@'x' is a reference to column 'x' and $$(@'x'*@'x') calculates squared value. The expression result will be used as a high border of the $RFloat call.
This plot shows result of the software execution:
